
Where rates fall today
Average rate–
Average APR–
Median APR–
Most lenders (APR)–
Rates as of November 22, 2026
Santa Cruz, CA 11/20/2026 6:00pm.
Showing 30-year fixed · Buy · All states
Lenders that changed the rate they publish for this loan, compared with the day, week and month before.
ClickTap a state to chart its rates above; clicktap it again for all states.
Banks, credit unions, mortgage companies and the rest, each as a group. Open one to see its lenders' rates.
How our average compares, the bond market, and where we think rates go next.
30-year fixed purchase rates as each source publishes them. Some publish weekly, so their lines move in steps. ClickTap a name to hide or show its line.
Mortgage rates tend to follow the 10-year Treasury yield. The red line is the spread: what lenders charge above it (also the shaded gap). A narrowing spread can bring rates down even when Treasuries hold still.
LoanGlass’s 30-year fixed benchmark slipped to 7.289% today, down from yesterday but still 0.088 percentage points above a week ago, while the 10-year Treasury yield fell to 4.910% , down 0.240 percentage points over the week. The recent bond-market move points to some easing pressure on mortgage rates: bond prices strengthened as stocks fell , and another report said the stock selloff pushed Treasury yields lower…
Key takeaways
Mortgage benchmarks generally moved lower today, though the week’s picture remains mixed. The LoanGlass 30-year fixed benchmark was 7.289%, down 0.051 percentage points from yesterday and up 0.088 from a week ago. The 30-year FHA benchmark stood at 7.462%, down 0.073 on the day but up 0.089 over the week; the 30-year VA benchmark was 6.961%, down 0.099 today and up 0.024 from last week. The 15-year fixed benchmark was 6.703%, down 0.058 today but up 0.062 over the week. The broad daily moves also leaned lower: 30.53% of tracked lenders cut rates by an average of 0.117 percentage points, while 16.57% raised them and 52.90% held steady.
The sharpest signal from the past few days came from government bonds. The 10-year Treasury yield reached 4.910%, a decline of 0.160 percentage points from yesterday and 0.240 from a week earlier. A bond-market update described prices strengthening as stocks fell, with overnight declines providing renewed support for bonds; another report said the stock selloff helped push Treasury yields down by more than 0.13 percentage points and the average 30-year mortgage rate down to 7.33%. That account linked the day’s rate relief to the bond rally following heavy stock-market losses. Still, lower Treasury yields have not erased the week’s increase in several LoanGlass fixed-rate benchmarks. The 30-year jumbo, for example, was 7.404%, down 0.050 today but up 0.141 over the week.
Commentary points to competing pressures behind the rate moves. A Federal Reserve governor warned that inflation remained too high and that further tightening might be needed; the discussion cited inflation of 3.80% in October, above the Fed’s 2.00% goal. That concern can keep longer-term borrowing costs elevated even when a short-term bond rally brings temporary relief. Housing reports also show the strain on buyers: new-home mortgage applications were 13.60% lower than a year earlier as rates and affordability weighed on demand. The day’s lower benchmark readings therefore offer some relief, but the week-over-week increases and persistent inflation worries suggest borrowers should not assume that rates will keep falling.
The LoanGlass 30-year fixed benchmark slipped to 7.289% today, down from yesterday but still slightly above a week ago, while the 10-year Treasury yield fell to 4.910% , 0.240 percentage points below its level a week earlier. The recent bond rally has helped rates ease, with average 30-year rates falling to 7.33% , but concern that inflation may prompt further Fed tightening could limit how far they drop. Over the…
Key Takeaways
LoanGlass benchmarks showed a small daily retreat, not yet a broad move below last week’s levels. The 30-year fixed rate was 7.289%, down 0.051 percentage points from yesterday but up 0.088 percentage points from a week earlier. The 15-year fixed benchmark stood at 6.703%, down 0.058 percentage points for the day and up 0.062 percentage points over the week. The 30-year FHA benchmark was 7.462%, while the VA benchmark was 6.961%. Lender pricing was mixed: 30.53% of tracked lenders lowered rates by an average of 0.117 percentage points, 16.57% raised them by 0.103 percentage points, and 52.90% made no change. These figures point to a modest daily improvement, but not a clear, market-wide downward trend.
The bond market has offered a more encouraging signal for borrowers. The 10-year Treasury yield was 4.910%, down 0.160 percentage points from yesterday and 0.240 percentage points from a week ago, after reaching 5.130% a month earlier. A report on Friday’s market move said a technology-stock selloff helped push Treasury yields lower and average 30-year mortgage rates down to 7.33%; however, the LoanGlass 30-year benchmark remains 0.088 percentage points above its level a week ago. Other rate reports also show uneven movement: national averages edged lower for some fixed loans while rates varied by loan type, while the 30-year average was reported at 7.39%, above the prior week. The mixed readings reinforce that a few days of falling bond yields have not yet established a lasting mortgage-rate decline.
Over the next 4 to 8 weeks, a reasonable expectation is for mortgage rates to move unevenly, with a chance of a gradual easing if Treasury yields continue to retreat. But the outlook remains tilted toward caution: Federal Reserve Governor Lisa Cook has questioned whether more action is needed to contain persistent inflation, and another report said inflation was 3.80% in October, still above the Fed’s 2.00% goal. Mortgage rates can respond to bond-market moves, Fed policy, economic conditions, and world events, so stock-market weakness alone may not be enough to bring borrowing costs down. If inflation or expectations of higher policy rates push Treasury yields back up, mortgage rates could rise again; if yields keep falling and lenders pass along the improvement, the LoanGlass 30-year benchmark could edge lower from 7.289%. Borrowers should plan for fluctuations rather than count on a sharp drop.
The LoanGlass 30-year fixed benchmark stands at 7.289%, up from 6.645% three months ago, even as the 10-year Treasury yield eased to 4.910% today. Over the next three to six months, mortgage rates are more likely to remain high or edge upward than fall sharply, as a Federal Reserve official warned that persistent inflation could require further tightening , while a market outlook projects rates near 7.2% through 2027…
Key Takeaways
Mortgage rates may edge down over the next three to six months, though borrowers should expect swings rather than a steady decline. The LoanGlass benchmark for a 30-year fixed mortgage is 7.289%, down 0.051 percentage points from yesterday but up from 6.645% three months ago. The 15-year fixed benchmark is 6.703%, while the FHA 30-year benchmark is 7.462%. Today’s mixed lender moves—30.53% lowered rates, 16.57% raised them, and 52.90% held steady—show that a one-day improvement does not yet mark a broad downward trend. The 10-year Treasury yield also slipped to 4.910%, but it remains above its 4.740% level three months ago.
There are reasons rates could ease: bonds strengthened as stocks sold off, and one market update said the 10-year Treasury yield fell by more than 0.13 percentage points as the average 30-year mortgage rate moved down to 7.33%. But inflation and Federal Reserve policy are significant counterweights. A Fed governor described inflation as “unacceptably high”, citing a 3.80% annual rate in October compared with the Fed’s 2.00% goal, and argued for tighter policy. Other market coverage reports that investors are weighing the possibility of another rate increase. Since long-term mortgage rates respond to bond-market expectations as well as Fed decisions, that uncertainty could limit any near-term decline.
Housing and mortgage forecasts also suggest relief may be gradual. The National Association of Realtors’ chief economist said pending sales could be near a low point as mortgage rates appear to have peaked, while warning that home sales may remain sluggish; pending sales fell 16.70% year over year in October. New-home mortgage applications were down 13.60% year over year, a sign that high borrowing costs are still weighing on buyers. The supplied material does not include current numerical rate forecasts from Fannie Mae, the Mortgage Bankers Association, Freddie Mac, or the Federal Reserve, so a precise forecast from those organizations cannot be stated here. Overall, the best-supported expectation is for mortgage rates to edge lower or move sideways over the next 3 to 6 months, with inflation surprises or renewed rate-hike fears capable of pushing them higher. Borrowers should compare written offers from several lenders because actual quotes vary by loan type and borrower.
The LoanGlass outlook, updated daily from our rate data and the bond market. A forecast, not a promise.
How many points lenders charge to lower a 30-year fixed rate by 0.25%, and what it says about where rates are headed.
30-year fixed purchase loans. Each day we measure how far each lender's rate moves per point it charges, for the lenders that publish more than one price (about 300 a day). The thin line is each day's market average and the bold line its 10-day average; the shaded band is the middle half of those lenders (also averaged over 10 days); the dotted line is 1 point, where most lenders price it. A point is 1% of the loan amount.
Today's mortgage headlines, and our latest articles.
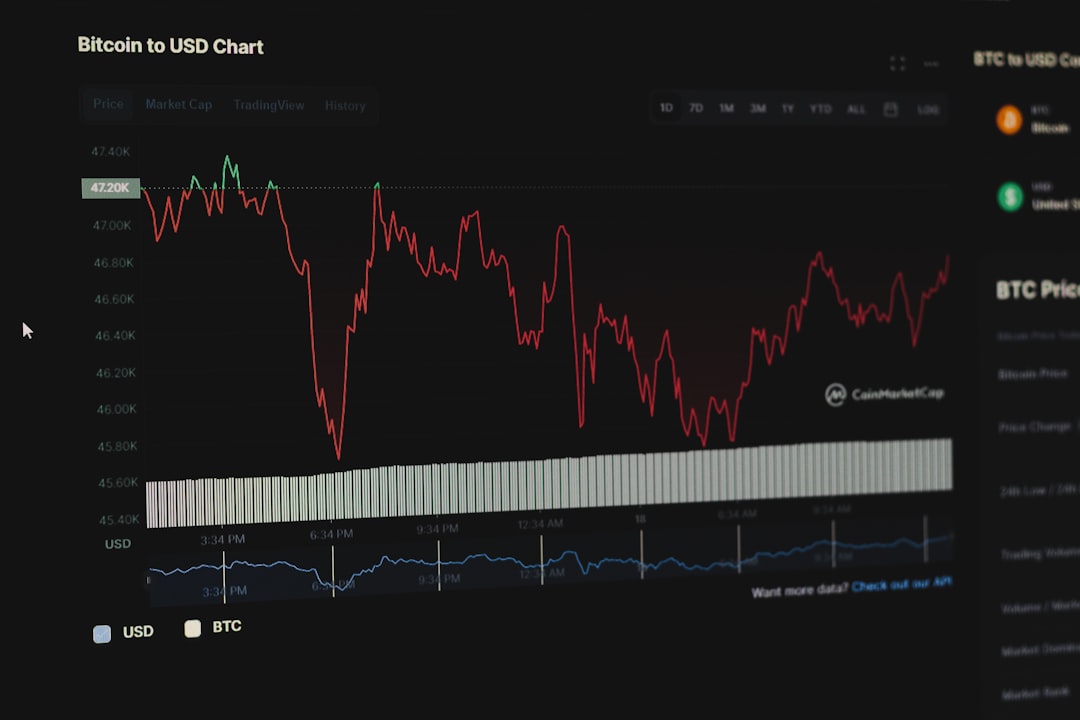
Investor Michael Burry warns that AI stocks could face a severe decline, comparing today’s market conditions to the crashes of 1929 and 2000. He argues that strong earnings do not prevent a market downturn and that rallies after a collapse can be misleading. A…

Most borrowers misunderstand how mortgage pricing actually works—rates vary widely, big lenders aren’t consistently cheapest, and 1–2 quotes often lead to…

From seeing real lender rates on LoanGlass.com to running your own numbers and learning what loan you qualify for, these free tools and guides give you…

The announcement comes as the platform surpasses 750 lenders tracked nationwide , positioning LoanGlass as one of the most comprehensive and unbiased…

The trigger lead ban forces lenders to rethink how they find buyers — and the answer isn't louder marketing, it's more transparent rates on platforms where…
How rates reach home buyers and builders, and how their response feeds back into rates.
Housing starts and building permits: U.S. Census Bureau (via FRED), monthly, at a seasonally adjusted yearly pace. Home-purchase applications: the Mortgage Bankers Association's weekly survey, compared with the same week a year earlier, as a four-week average (above the dotted line, more people are applying for a loan to buy a home than a year before). Refinance share: refinances as a share of all applications in the same survey, four-week average. 30-year rate: MBA's average contract rate on conforming loans.
Disclaimer
LoanGlass is not a lender. LoanGlass (formerly mortgage-rates.ai) is an independent site that helps borrowers compare mortgage rates. We are not a lender, mortgage broker or financial advisor, and we are not registered with the Nationwide Multistate Licensing System (NMLS). Nothing on this site is an offer to lend.
Where the rates come from
Every day we collect the rates that more than 1000 lenders publish on their own websites, and we show them as published. Averages, ranges, charts and forecasts are our own calculations, and forecasts may be wrong. Lender records, reviews and market data come from public sources such as the NMLS, NCUA, OCC, HMDA filings, the U.S. Treasury, Freddie Mac and Bankrate. We work to keep it all accurate, but it may contain errors.
Your rate may differ
The rate a lender offers you depends on your credit, income, down payment, loan and property, and you may not qualify for every rate shown. Payments shown with rates are principal and interest only; taxes and insurance are extra. Calculator results are estimates. Ask lenders for an official Loan Estimate before you decide.
Promoted listings
Lenders are included for free, but some pay for promotion. Promoted lenders are marked "Promoted" and appear above other lenders in rate results, whatever their rate. Paid placement can also decide the order between lenders that show the same rate. Paying never changes the rates a lender publishes.
Questions or corrections?
To report an error or have your institution's rates included, email content@loanglass.com.
All logos, trademarks and brand names belong to their owners.
What would make LoanGlass more useful to you?
We appreciate your feedback.
We use cookies and similar technologies to improve your experience, analyze site usage, and deliver personalized content. By clicking "Accept", you agree to the storing of cookies on your device in accordance with our Privacy Policy. You can manage your cookie preferences at any time.